
CIO's Letter: H1 2026 Market Insights
10 July 2026
Sign up to our newsletter for regular insights from the Hundle team.
The first half of 2026 was defined by volatility, policy uncertainty and repeated tests of investor confidence. Markets absorbed geopolitical shocks, shifting monetary policy expectations, renewed tariff concerns, questions over AI capital spending, energy-price volatility and one of the largest IPOs in market history. Yet risk assets proved more resilient than the headlines suggested.
The period can be understood as a sequence of shocks and rotations. January began with a flight to safety, as gold broke above $5,000 per ounce amid geopolitical tension and increasing inflation-expectations, dollar weakness and concerns over U.S. policymaking. In February, the Magnificent Seven trade began to fracture, with investors rotating from AI platform companies toward semiconductors, memory, equipment, power and cooling. March brought the Iran conflict and disruption around the Strait of Hormuz, reviving energy-inflation risk just as markets had been assuming inflation would continue to cool. The pursuit for liquidity led even gold as a safe-haven asset to lose 25% in March.
By April, equities had largely looked through the shock, supported by earnings strength and AI infrastructure demand. May reinforced the same leadership shift, with memory and semiconductor names becoming the clearest winners. June added new uncertainty, as large IPOs such as SpaceX showed continued appetite for category-defining growth, while Kevin Warsh’s Fed made markets more sensitive to each inflation print, jobs report and policy signal.
The key point is that this was not a simple risk-on market. It was a rotation market. Investors moved from AI platforms to AI infrastructure, from valuation-led returns to earnings-led returns and from broad beta toward more selective exposure. Index-level performance looked strong in places, but underlying leadership became narrower and more concentrated.
The result was a market that was volatile at the macro level but resilient at the index level. Beneath the surface, however, that resilience was narrow. The key themes we anticipate for the second half of the year therefore are the same forces that shaped the first half including the rotation to AI infrastructure, the narrowing of market leadership, resilient but tightly valued credit markets, an inflation floor that limits central bank flexibility and a Federal Reserve that may say less, but move markets more.
Key themes from H1 2026:
The Great AI Trade Rotation
For the past three years, market leadership had been dominated by the Magnificent Seven. These companies were treated as a single expression of AI, scale, quality and balance-sheet strength. In 2026, that trade fractured. The group no longer moved as one and performance within the basket became highly dispersed. The Magnificent Seven underperformed broader equity indices despite the market reaching new highs. On a year-to-date basis, the basket has been broadly flat, with several constituents in negative territory, and has even underperformed UK 10-year Gilts.
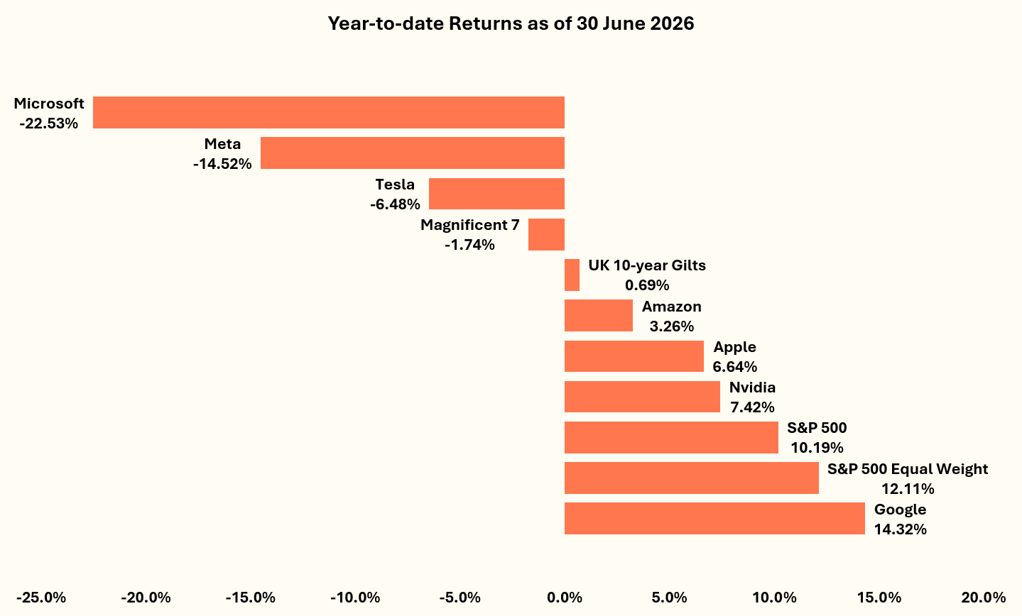
Exhibit 1: YTD Returns Show the Mag 7 Trade Has Fractured
Source: Bloomberg
That marks a meaningful regime change. The market has not turned against AI, but it has become more selective about where the value is being captured. Last year, investors were asking which companies had broad AI exposure. This year, the question is more specific around which companies are converting AI capital expenditure into revenue growth, pricing power and earnings today?
The Winners of the Rotation: Semiconductors
The answer, so far, has been the infrastructure layer.
Leadership has rotated away from mega-cap platform companies and toward the semiconductor supply chain, where AI capex is translating more directly into earnings revisions, revenue visibility and pricing power. The scale of the rotation has been striking. In H1, the PHLX Semiconductor Index rose around 102% in U.S. Dollar terms, while the S&P 500 gained around 10% and the Magnificent Seven fell roughly 2% as a group.
The strength of the semiconductor rally has been exceptional. Semiconductor stocks are experiencing one of their strongest momentum periods in three decades, with rolling 14-month returns approaching levels previously seen only during the dot-com era as shown in Exhibit 2.
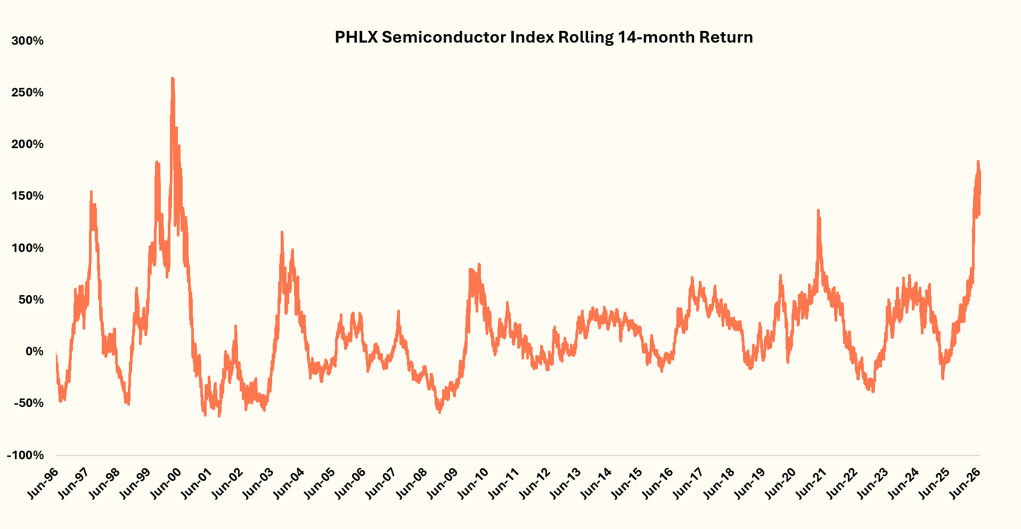
Exhibit 2: Semiconductor Momentum Nears Dot-Com Era Extremes
Source: Bloomberg
The SOX Index’s outperformance relative to the S&P 500 has also reached a 30-year high, surpassing even the peak levels seen during the dot-com period.
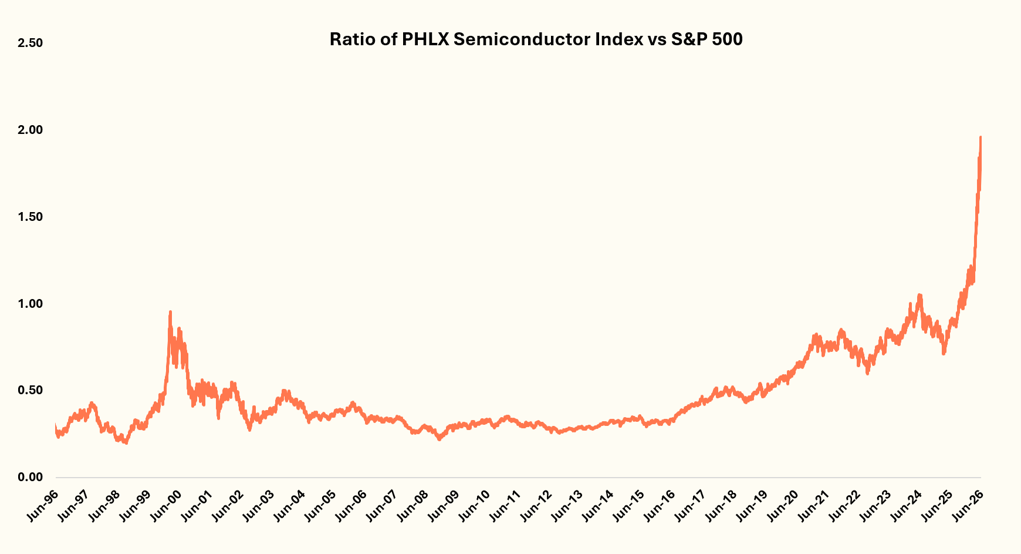
Exhibit 3: SOX Relative Performance vs S&P 500 Reaches a 30-Year High
Source: Bloomberg
The comparison with 2000 is useful, but it should not be overstated. Today’s AI cycle is supported by stronger fundamentals, including real revenues, higher margins, stronger balance sheets and clearer demand visibility. Even so, history argues for discipline. Returns of this magnitude are rarely sustained without pauses, corrections or a broader handover in leadership. Semiconductor leadership can continue if earnings revisions and AI demand remain strong, but the market is more vulnerable if expectations weaken because so much of the rally is now concentrated in this sector.
From Mag 7 to Memory’s Big Three
Within the semiconductor complex, memory suppliers have been the clearest winners. Samsung, SK Hynix and Micron have gained 177%, 305% and 304%, respectively, as investors have moved aggressively into the companies most directly exposed to AI data-centre demand. These firms produce both standard memory for consumer devices and high-bandwidth memory for AI workloads. As production has shifted toward higher-margin AI memory, supply in traditional memory markets has tightened, pushing prices higher across the broader memory complex.
Korea shows how powerful, and increasingly crowded, this trade has become in Exhibit 4. The KOSPI Index has surged as investors have rotated into Samsung Electronics and SK Hynix, which together account for around 53% of the index’s value. At the same time, the volatility index on the Kospi – VKOSPI – often referred to as Korea’s “fear index”, has spiked to unusually high levels. This combination of rising prices and rising volatility suggests that Korea has become one of the clearest high-beta expressions of the global AI infrastructure theme.
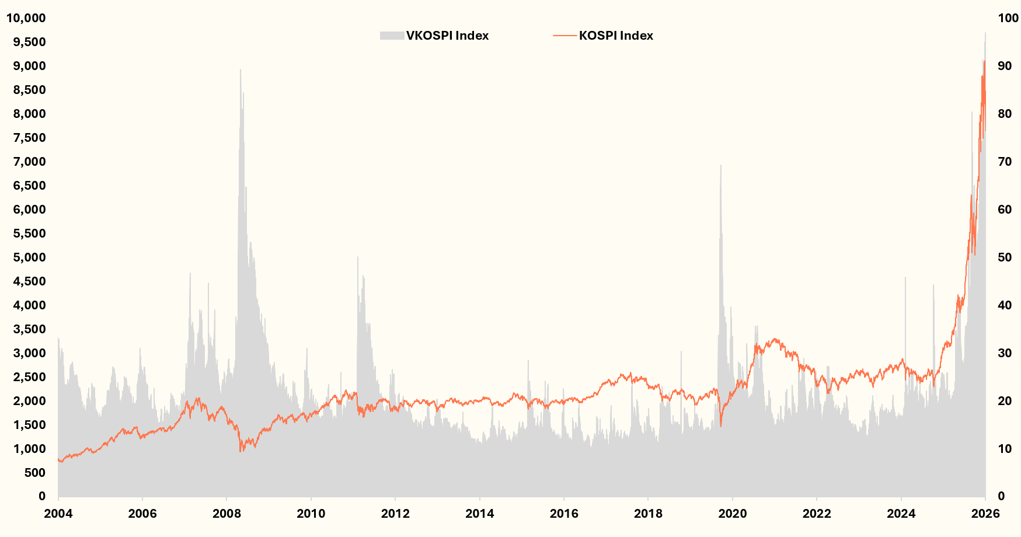
Exhibit 4: KOSPI and VKOSPI Index Performance
Source: Bloomberg
For H2, performance will be highly sensitive to memory pricing, AI capex revisions and any signs that semiconductor demand is slowing.
Market Resilience Masked Narrow Leadership
Headline market performance looked stronger than the macro backdrop suggested, but resilience was highly concentrated. Equities absorbed geopolitical shocks, energy volatility, tariff uncertainty and a more complicated Fed outlook, yet leadership remained narrow.
The clearest example was semiconductors, but the same pattern appeared globally. Emerging markets are up around 23% year-to-date, yet an equal-weighted EM index is up only around 4%, showing that much of the rally has been driven by AI and technology exposure, particularly in Asia.
This concentration is also visible in global equity indices as shown in Exhibit 5. The U.S. now accounts for a historically large share of global market capitalisation, while technology’s weight has risen sharply, approaching levels last seen during the dot-com era. This helps explain why headline index performance can look resilient even when underlying breadth is weaker: a smaller group of large U.S. technology and AI-linked companies is driving a disproportionate share of returns.
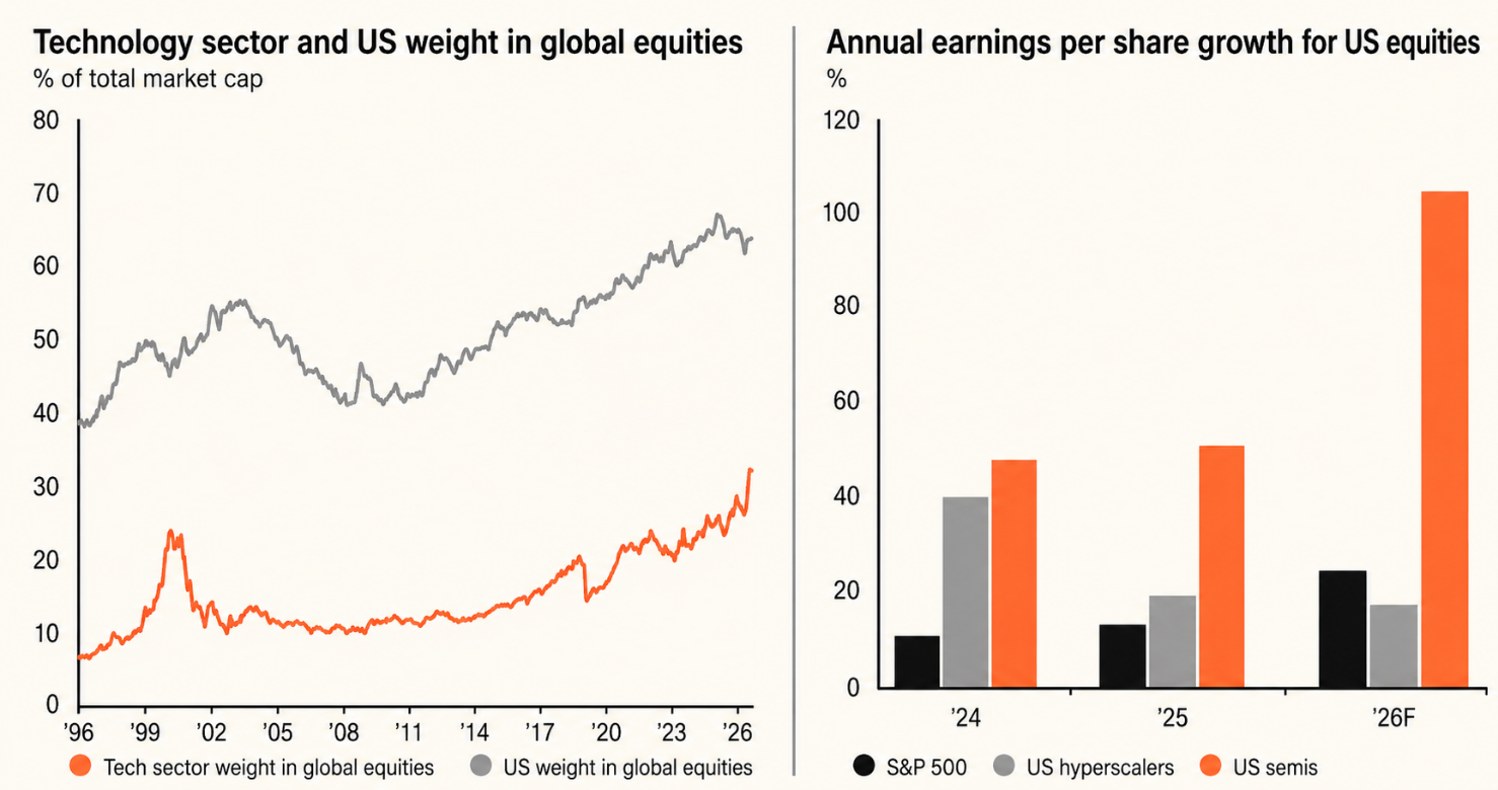
Exhibit 5: Technology and U.S. Dominance in Global Equities
Source: JPM Research
Credit Stayed Calm Within the Storm
Beyond equities, credit markets remained one of the key stabilisers in 2026. Investment-grade and high-yield spreads remained contained, which helped investors interpret equity weakness as rotation rather than systemic stress. However, resilient credit does not mean cheap credit. Spreads remain tight relative to the level of macro uncertainty, so investors are not being paid generously for broad credit beta. All-in yields remain appealing, but the compensation for taking incremental credit risk is less compelling. This reinforces the case for idiosyncratic and flexible credit strategies over passive benchmark exposure.
As Exhibit 6 shows, the recent tick-up in credit spreads is muted when compared to last year’s Liberation Day sell-off, let alone the 2015 energy sell-off after oil prices collapsed or the Covid spike.
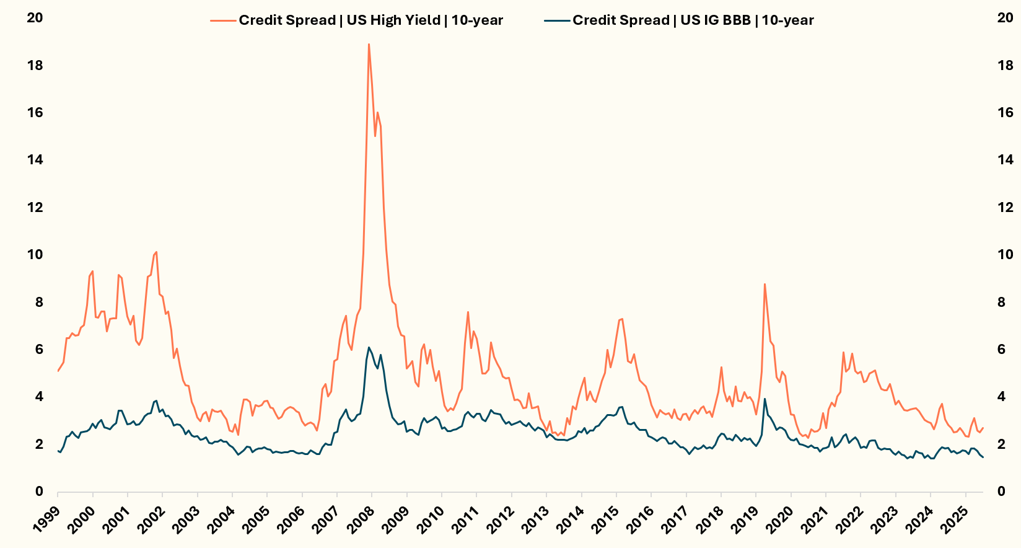
Exhibit 6: Spread on high yield and investment grade corporate bonds
Source: Bloomberg
Earnings, Not Valuations, Drove the Bull Market
A key difference between the current bull market and more speculative rallies is that it has been supported by earnings growth, not just valuation expansion. Exhibit 7 shows the S&P 500 rising alongside both trailing 12-month earnings and forward earnings expectations.
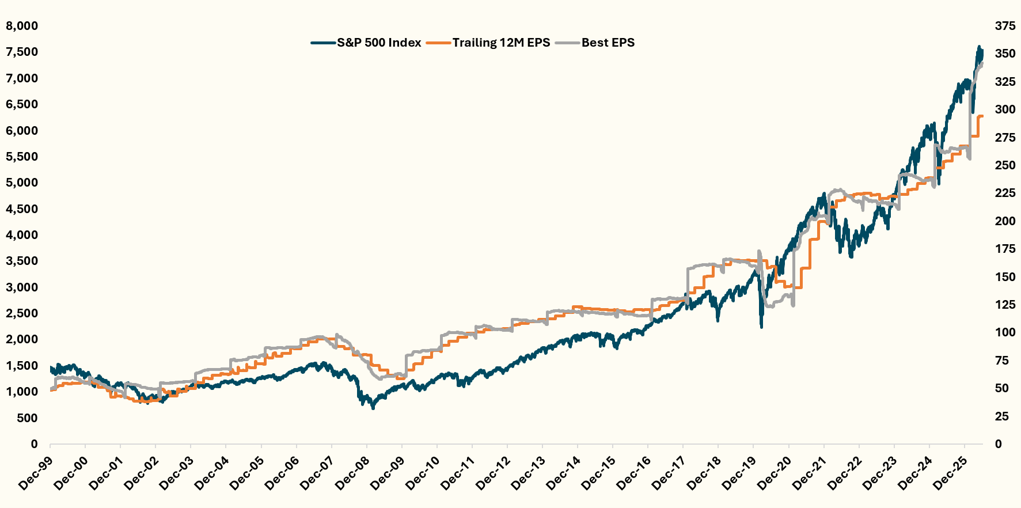
Exhibit 7: S&P 500 vs Trailing 12M EPS vs Best EPS
Source: Bloomberg
Earnings-led rallies are generally healthier than multiple-led ones because share-price gains are supported by rising profits, not just higher valuations. This helps explain why equities have looked through repeated macro shocks in 2026, particularly in technology, semiconductors, and AI infrastructure.
But it also raises the bar for the remaining year. If earnings are driving the bull market, they need to keep delivering.
Inflation, the Fed, and the Un-Debasement Trade
The inflation story became more complicated through 2026. The Iran conflict and disruption around the Strait of Hormuz initially revived fears of a renewed energy shock, with markets worrying that higher oil prices would push inflation expectations higher and make the Fed’s job harder. But as the geopolitical risk premium faded and oil moved back toward pre-war levels, those fears eased.
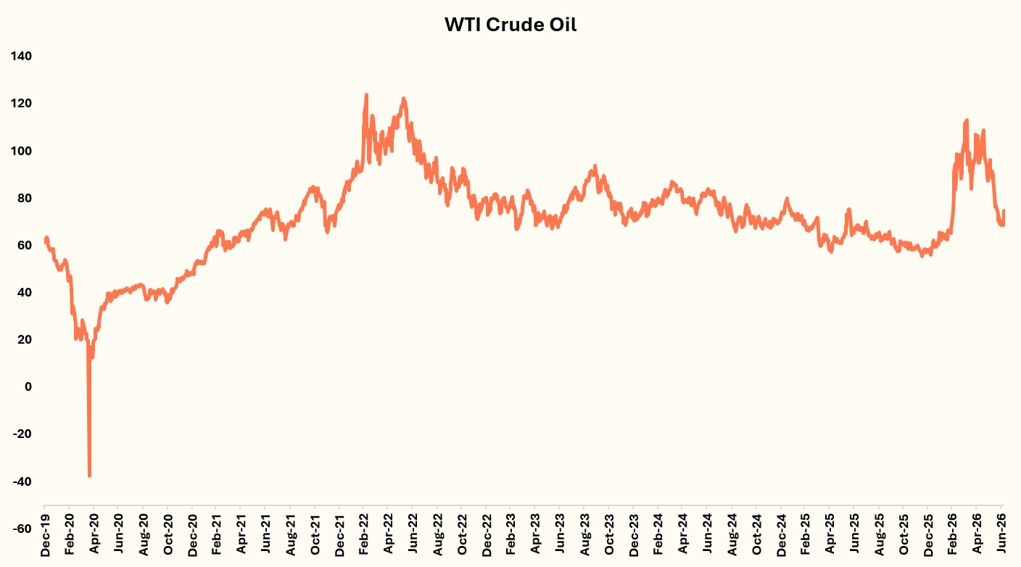
Exhibit 8: Oil’s Round Trip: From Hormuz Shock Back to Pre-War Levels
Source: Bloomberg
The more important issue for the second half of the year is the inflation floor. Tariffs, fiscal deficits, still-resilient demand and a tight, though softening, labour market all suggest inflation may settle above the pre-pandemic norm, even if headline inflation continues to moderate. The June jobs report added nuance to this picture. Payrolls rose by only 57,000, while April and May were revised down by a combined 74,000. The data did not overturn the resilience story, but it made the labour-market trend look less convincing, particularly as job creation was concentrated in less cyclical areas such as healthcare.
This leaves the Fed with a difficult trade-off. Softer labour data should give policymakers more room to ease, but sticky inflation limits that flexibility. Markets began the year still expecting rate cuts, but by mid-year the debate had shifted toward higher-for-longer and, in some scenarios, renewed hikes. Kevin Warsh’s debut as Fed chair reinforced that shift, with market expectations moving from cuts to hikes (Exhibit 9).
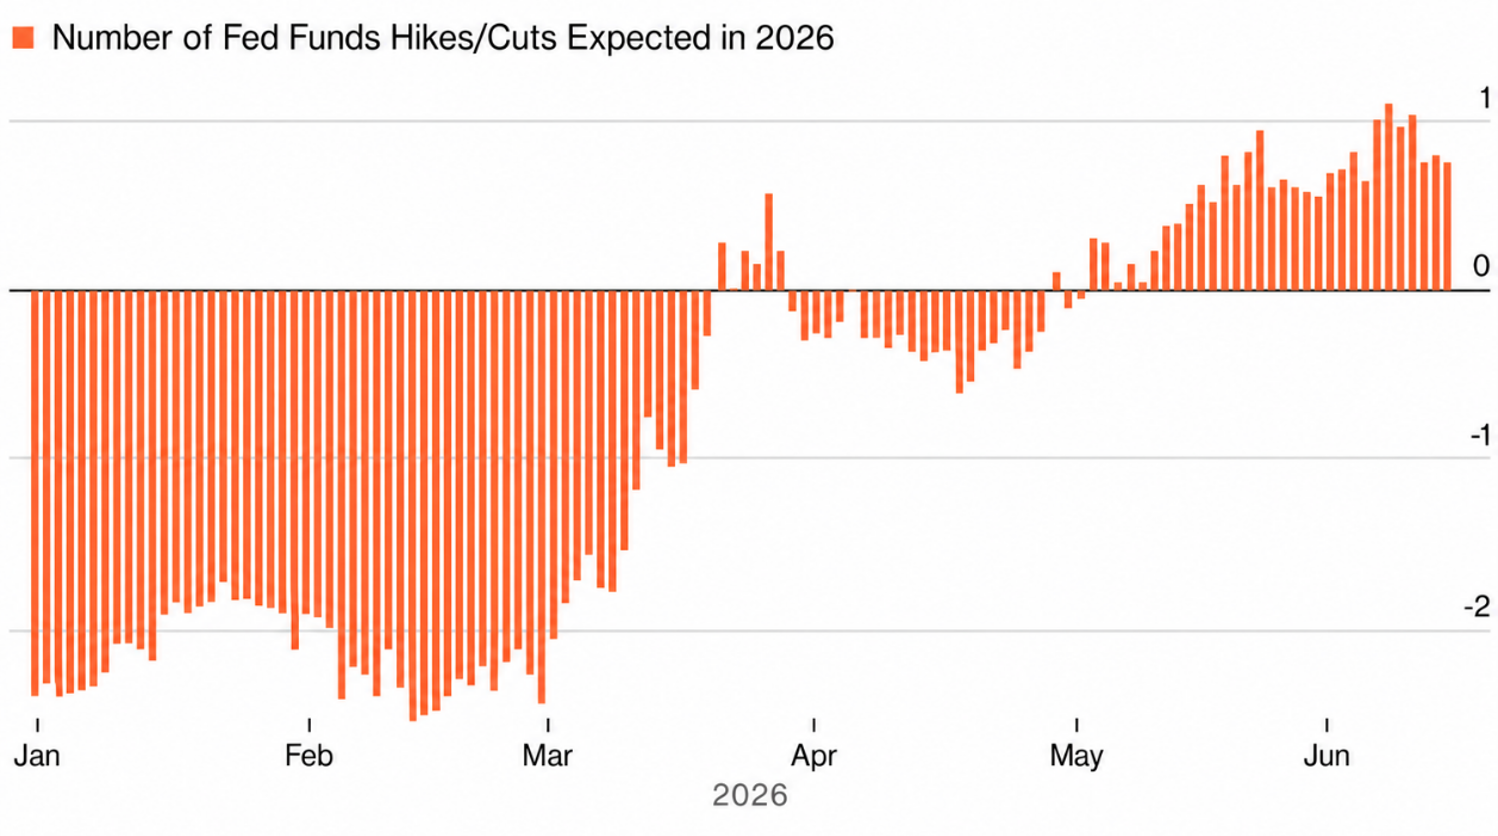
Exhibit 9: Market expectations have shifted from rate cuts at the start of the year to a higher-for-longer Fed path by mid-year
Source: Bloomberg
Warsh’s focus on price stability helped restore credibility, but his preference for less guidance makes the reaction function harder to read. With fewer signals from the Fed, markets may become more sensitive to each inflation print, labour-market report and policy speech.
The US Dollar’s recovery reinforces the shift away from the debasement trade. Earlier in the year, US Dollar weakness, fiscal anxiety and concerns over policy credibility supported gold and other alternatives to fiat currency. More recently, that trade has reversed. Gold fell below $4,000 per ounce in late June, pressured by a stronger dollar, higher-rate expectations and easing geopolitical stress. Bitcoin also failed to behave like digital gold, falling more than 50% from its October 2025 high and trading more like a high-beta liquidity asset than a defensive hedge.
Exhibit 10 highlights that the US Dollar’s traditional inverse relationship with equities has begun to re-emerge, reinforcing its role as a safe-haven asset when geopolitical uncertainty rises and Fed policy turns less supportive.
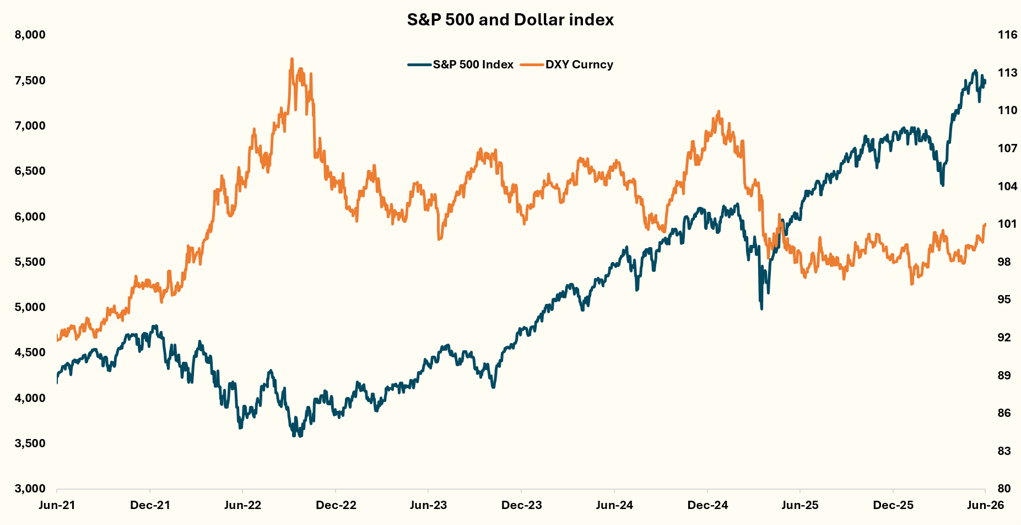
Exhibit 10: S&P 500 and USD Index Performance
Source: Bloomberg
Capital Markets Reopened, but Selectively
Despite macro volatility, capital markets did not close. Investors remained willing to fund large, category-defining growth companies, but only selectively. SpaceX’s record IPO, which raised approximately $85 billion, showed that risk appetite remained intact for businesses with scarcity value, strong secular growth narratives and exposure to themes such as space, infrastructure, AI and platform economics.
However, the broader message is not that the IPO market has reopened indiscriminately. SpaceX is now valued among the world’s largest companies despite generating far less revenue and profit than mega-cap peers such as Microsoft or Amazon. That highlights how much of the valuation rests on future growth expectations rather than current financial performance.
This fits the broader 2026 pattern. Investors were not avoiding risk, but they were becoming more selective about which risks were worth owning. The same discipline visible in public equities, where leadership narrowed toward semiconductors and AI infrastructure, also appeared in newly listed markets. Capital was available, but only for the strongest stories.
The caution for H2 is that IPO excitement can fade quickly. Historical data shows that many IPOs struggle to outperform the broader market over their first full year of trading, making it important to distinguish between first-day momentum and durable long-term fundamentals.
Japan: The Positive Reflation Exception
Japan stands out as the positive exception to the inflation story. After decades of deflation and weak nominal growth, moderate inflation has become more constructive, supporting nominal revenues, pricing power and wage growth. The equity-market case has also been reinforced by governance reform, stronger shareholder focus and improving returns on equity. This combination has made Japan increasingly attractive to global investors, with the Nikkei 225 up around 39% year-to-date and among the strongest-performing major equity indices.
The main risk is the Yen. The currency has weakened sharply, recently trading near ¥161.90 per US Dollar, its weakest level since 1986. This is not simply a dollar-strength story. The Yen has continued to weaken even as Japanese government bond yields have risen relative to U.S. Treasuries, suggesting that rate differentials alone no longer explain the move. Persistent carry-trade flows, scepticism over how far the Bank of Japan will tighten and continued demand for foreign assets have outweighed the support from higher domestic yields.
That combination of rising bond yields and a falling currency deserves attention. It is more often associated with markets where investors are questioning policy credibility or fiscal sustainability. Japan’s reflation story remains constructive for equities, but currency volatility is now the key macro risk to monitor, whether through disorderly Yen weakness or a sharp reversal if the carry trade unwinds.
Conclusion
The lessons from the first half of the year are clear. This is not a market for indiscriminate beta. It is a market for selectivity, discipline and genuine diversification. Markets can remain resilient if earnings continue to deliver, credit stays stable and leadership broadens. But if the rally remains narrow, AI expectations become too aggressive or inflation keeps the Fed constrained, the margin for error in the second half will be much smaller than headline indices imply.