
Q3, Markets Review 2026: Resilience in an Uncertain Landscape
23 October 2026
Sign up to our newsletter for regular insights from the Hundle team.
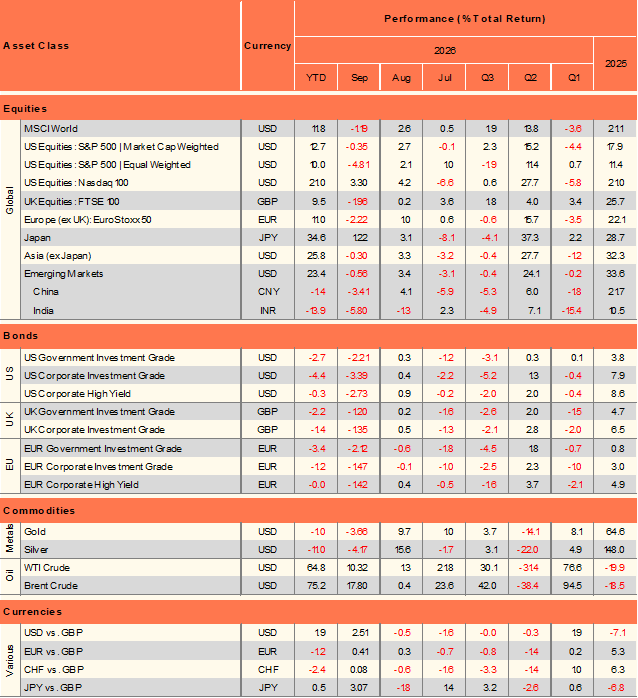
The third quarter of 2026 reinforced the same theme we covered in our H1 2026 review. Since the beginning of the year, investors have had to absorb a fairly extraordinary combination of risks. US bond yields approached 6% (the US 30-year Treasury Index hitting a 24-high of 5.63% in September), oil traded above $100 a barrel and inflation reached 3.7%, around 1.7% above the Fed’s 2% target. And yet, the S&P 500 still managed to record 28 all-time closing highs.
We started the year expecting three Fed rate cuts, which would normally be supportive for equities. Instead, we experienced a major energy shock, hotter-than-expected inflation and a complete reversal in the rate narrative, with markets moving from pricing cuts to pricing two hikes, one already delivered and another potentially still to come. At the headline level, the market has been remarkably resilient.
The S&P 500 was up around 12.7% year-to-date by quarter-end, but leadership remained narrow. AI continued to dominate, although the trade became more fragmented across semiconductors, memory, hyperscalers and infrastructure. Meanwhile, 40% of S&P 500 companies were already more than 20% below their all-time highs.
Earnings remained the strongest support for equities, with S&P 500 companies beating estimates by 13.8% on average across the four quarters through Q2. But some headline profits also benefited from rising private AI valuations, making the source and sustainability of earnings increasingly important.
The macro backdrop remained resilient but uncomfortable. Consumer spending held up, helped by rising household wealth and a still-stable labour market, while inflation and energy prices stayed elevated and the rate debate shifted from cuts towards renewed tightening.
The biggest shift came in fixed income. Higher real yields, heavier government borrowing and rising corporate funding needs pushed long-term yields higher, while the AI build-out increasingly moved into bond markets and private credit.
Our Q4 view is therefore one of greater selectivity, not broad risk aversion. Equities can still perform if earnings hold up, but high-quality bonds and cash now offer credible alternatives.
Market Data as of 30 September 2026:
Key themes dominating the market
The market continues to be shaped by three central questions:
- Can AI continue to deliver on increasingly demanding expectations?
- Can inflation move sustainably back towards long-term target?
- How much more can consumers, companies and bond markets absorb as borrowing costs, energy prices and capital requirements remain elevated?
These themes are increasingly interconnected. AI is supporting earnings and investment, inflation is determining the path of monetary policy, and higher financing costs are testing the resilience of households, corporates and governments alike.
- A Rally Led by Few
In our Q2 review, we argued that the Magnificent Seven was no longer one coherent AI trade. Q3 pushed that idea further.
AI leadership has continued to spread across the value chain, but not evenly. Semiconductors, memory, hyperscalers and infrastructure have increasingly moved on their own fundamentals, while the original Magnificent Seven basket has lagged the strongest parts of the theme.
Year-to-date, the semiconductor index (SOX) has returned +78.29%, outperforming the NASDAQ 100 (+20.43%) and the S&P 500 (12.70%). The Magnificent 7 basket has lagged all three indices and returned +9.17%.
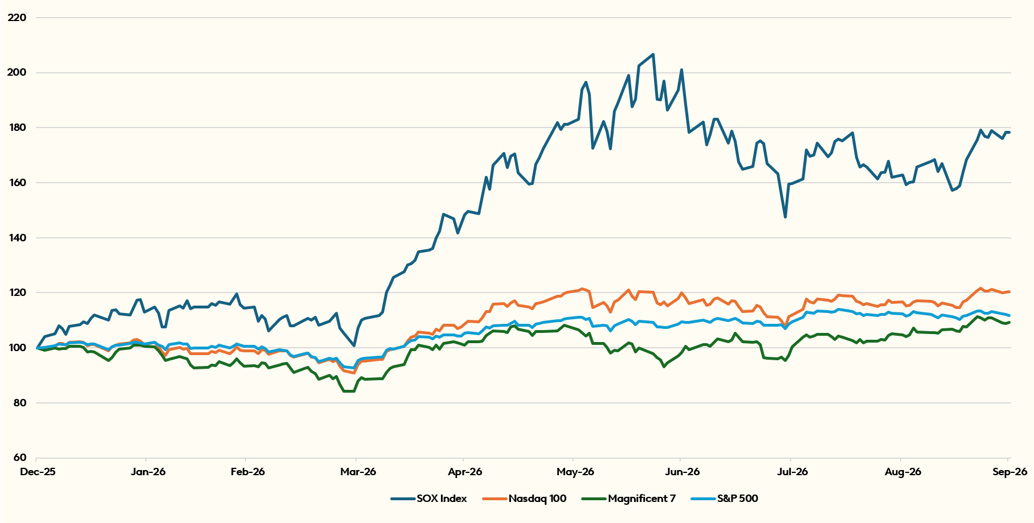
Exhibit 1: Year-to-date returns show the dispersion across the AI trade
Source: Bloomberg
That tells us the AI trade is still very much alive, but it is no longer broad. Investors are becoming much more selective about where the earnings, pricing power and scarcity actually sit. The positive side of this dispersion is that it creates a better environment for stock selection. The cross-stock correlation between the S&P 500 portfolio companies is at a historical low.
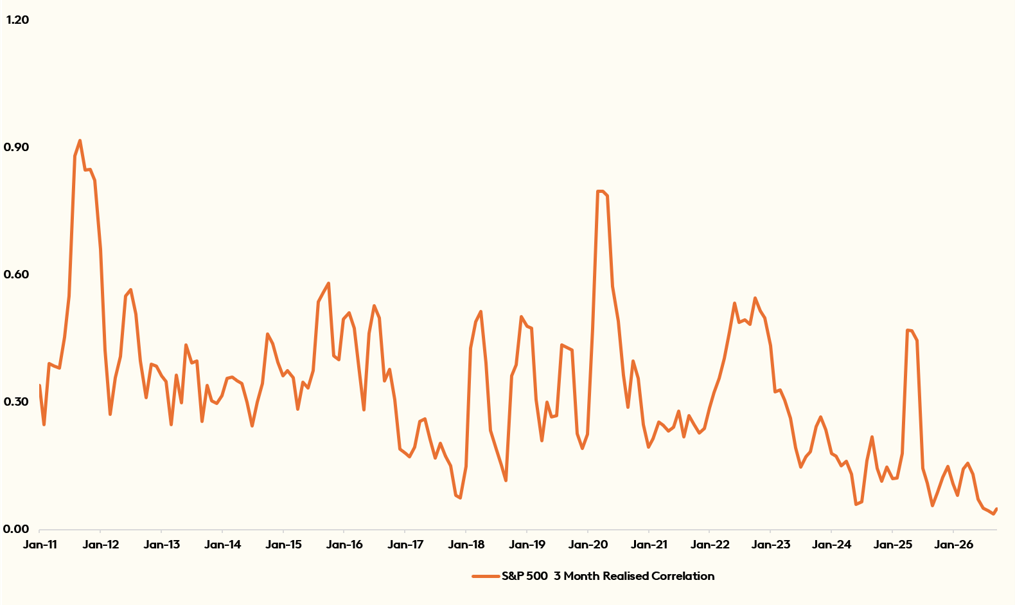
Exhibit 2: Extreme levels of dispersion in the S&P 500 warrants active stock selection
Source: Bloomberg
The same pattern is visible in the wider market. The S&P 500 has rallied this year, but around 40% of S&P 500 companies are already more than 20% below their all-time highs. The gap between the cap-weighted and equal-weighted S&P 500 (as shown in Exhibit 3) reinforces the point. A relatively small number of very large companies are doing a disproportionate amount of the work. A decreasing ratio means that the S&P 500 Equal-Weight Index outperforms the S&P 500 Market Cap-Weight Index. A rising ratio means that the S&P 500 Market Cap-Weight Index outperforms the S&P 500 Equal-Weight Index.
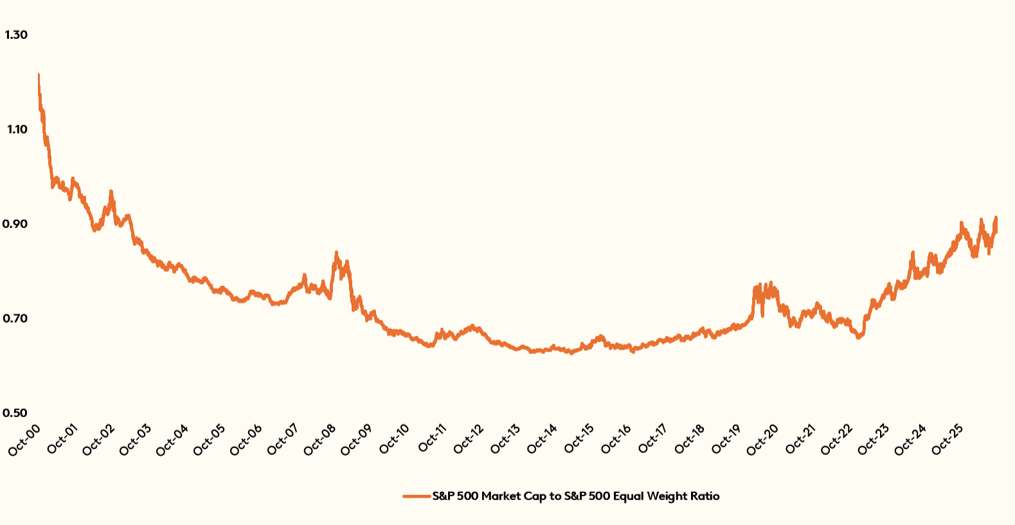
Exhibit 3: The S&P 500 Market Cap / S&P 500 Equal Weight ratio is at 0.9x
Source: Bloomberg
That creates an increasingly awkward portfolio problem. Avoid the largest technology companies and you risk lagging the benchmark. Own too much of them and diversification starts to look more theoretical than practical.
So, the headline index still looks healthy, but the underlying market is far more selective than it appears.
And this is not only a US problem. Concentration is increasingly visible across global markets too, particularly where semiconductor and technology exposure dominates local indices.
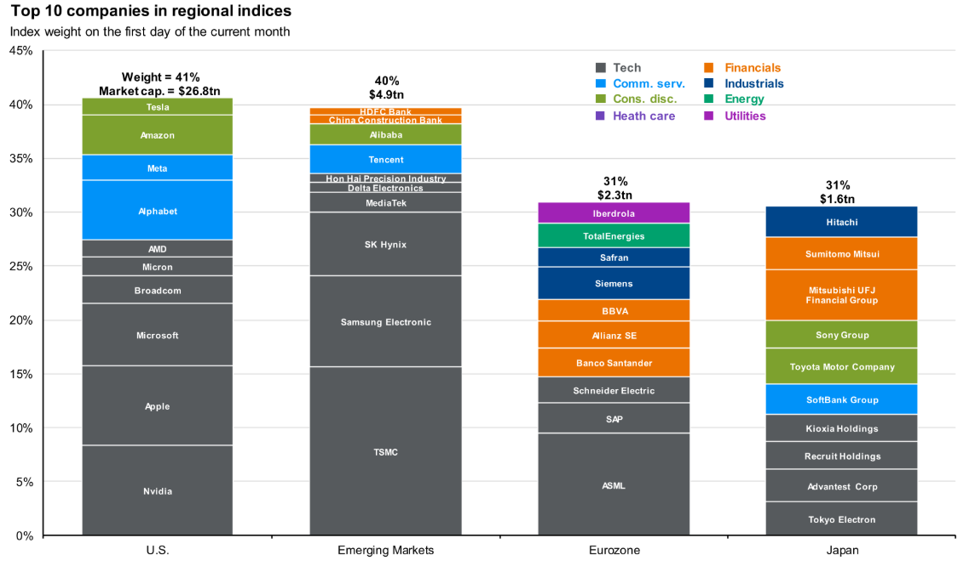
Exhibit 4: Global Index Level Concentration
Source: JP Morgan
If you squint hard enough, diversification still exists. Parts of Europe and Japan continue to offer genuinely different earnings drivers through banks, industrials, defence, infrastructure and automation rather than another version of the same AI exposure.
Market leadership has become narrower and more fragmented, making returns increasingly dependent on selecting the right parts of the value chain. This creates a diversification dilemma. Passive allocations across equity indices can leave portfolios concentrated in the same underlying theme, while diversifying beyond technology risks lagging the benchmark. The challenge is to reduce that shared concentration while retaining exposure to the areas driving market performance.
- Extraordinary* Earnings Playing Defence
The strongest argument for equities remains earnings. The Q2 earnings season has been exceptionally strong. Around 86% of reporting S&P 500 companies have beaten analysts’ earnings expectations, and aggregate earnings are running around 29% above estimates. Corporate profitability is also historically high. Corporate profits now represent around 14.9% of GDP, compared with a long-term average of roughly 10.1%.
There is, however, an important reason for the asterisk next to “extraordinary”.
Alphabet reported $98bn of other income in Q2, largely from unrealised gains on equity securities, while Amazon reported $53.4bn, primarily linked to its investment in Anthropic. Both businesses still generated very strong operating profits, so this is not a case of accounting gains rescuing weak companies. But it does mean headline earnings have received a meaningful boost from rising private AI valuations.
That matters because these are, in part, paper gains. If private AI valuations continue to rise, reported earnings can continue to benefit. If valuations fall, the same mechanism can work in reverse. So, the earnings story is still very strong, just perhaps slightly less “greatest earnings season in recorded history” once you look under the bonnet.
The broader issue is that future earnings growth is becoming increasingly dependent on companies sustaining already-elevated margins. Exhibit 5 shows that the S&P 500’s projected 31.6% EPS growth in 2026 relies heavily on margin expansion, which accounts for around 19.5% of that increase. With profit margins estimated at roughly 15.9% in Q3 2026, already high by historical standards, the bar is becoming more demanding. That leaves less room for disappointment. If wage costs, energy prices or financing costs rise, or if revenue growth simply slows, earnings expectations could become much harder to deliver.
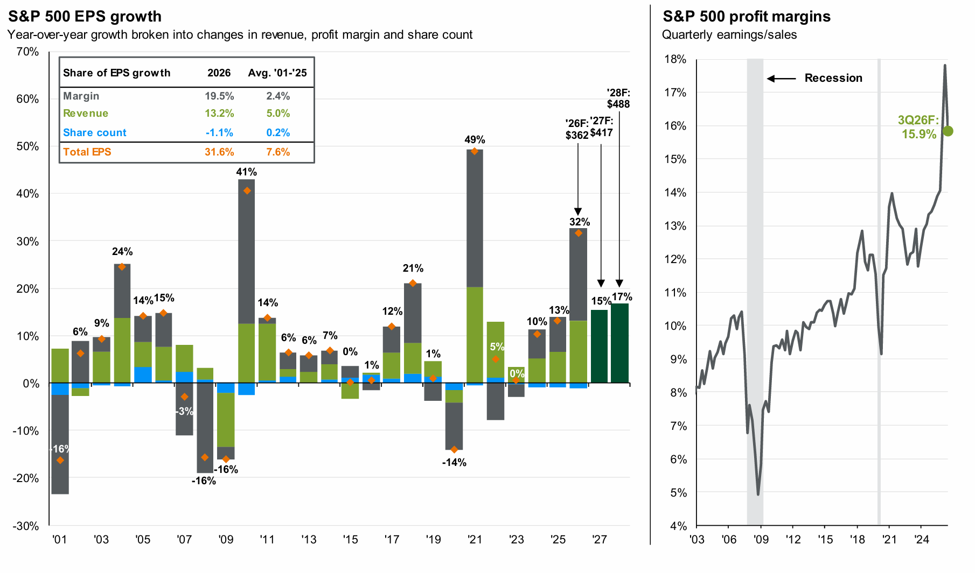
Exhibit 5: Sources of earnings growth and profit margins
Source: JP Morgan
The key point is that earnings are still supporting the market, but increasingly they need margins, private valuations and strong demand all to keep moving in the right direction.
Valuations have also come down from their 2026 highs. The S&P 500 forward P/E was around 20.1x in late July, down from 20.4x at the end of Q2 and only modestly above its ten-year average of 19.0x. That is encouraging, but the denominator is doing quite a lot of the heavy lifting. If earnings keep growing at 25% to 30%, valuations can look cheaper very quickly. If that growth slows while the risk-free rate stays high, those same multiples become much harder to defend.
- The Next Test: Turning Private Valuations into Public Prices
Strip the AI ecosystem back and the investment thesis largely comes down to two things. The models, and the infrastructure needed to run them.
The infrastructure side is easier to understand. Chips, memory, power and data-centre capacity are scarce, capital-intensive and difficult to replicate quickly. The model layer is less obvious. Users can move between ChatGPT, Claude, Moonshot and whatever comes next with relatively little friction, while the capabilities of leading models are becoming increasingly similar.
That makes the long-term moat around the models themselves harder to define. The more durable advantages may ultimately lie in distribution, proprietary data, workflow integration, customer lock-in and the ability to deliver intelligence at a lower cost, rather than simply having the best model at a particular point in time.
Public markets will eventually have to put a price on that distinction.
There is also an important degree of circularity in the ecosystem. Hyperscalers invest in AI developers, those developers spend heavily on compute from the same cloud providers, cloud revenues rise, and higher private-market valuations can generate investment gains for the original investors. The demand is real, but the loop makes the source and sustainability of that demand increasingly important.
That is why a large OpenAI or Anthropic listing could be such an important test. It would not simply add more equity supply. It would force public-market investors to decide whether they are being offered a genuinely differentiated business with durable pricing power, or simply another route into an AI exposure they may already own several times over.
In other words, the IPO market may become the point where private-market enthusiasm finally has to meet public-market discipline.
- Resilient Growth, but an Increasingly K-Shaped Consumer
Global growth has remained resilient so far. The IMF has now raised its 2026 global growth forecast to 3.1%, citing resilient economies and AI investment.
US real final sales to private domestic purchasers, which captures consumer spending and private fixed investment, rose at a 4.2% annualised rate in Q2, despite higher borrowing costs and elevated uncertainty.
A large part of that resilience came from the consumer. Household net worth rose by an extraordinary $12.8tn during Q2 to $195.9tn, with roughly $10.7tn of that increase coming from gains in corporate equities. The ratio of household net worth to disposable income reached a record 8.28x.
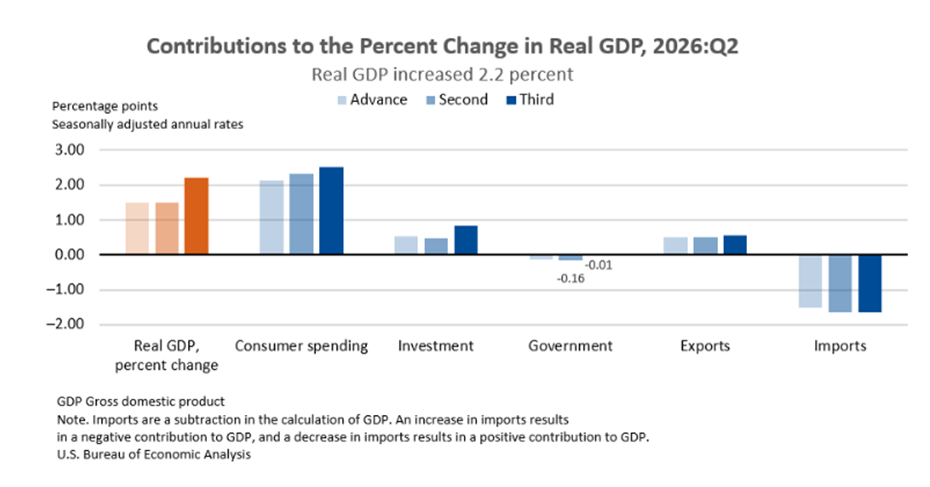
Exhibit 6: Contribution to Change in Real GDP, Q2 2026
Source: U.S. Bureau of Economic Analysis
Higher rates have been painful for borrowers, but rising equity markets have made asset-owning households considerably wealthier. The labour market is helping too. Employment conditions increasingly look “low hire, low fire”. Companies are becoming more cautious about adding workers, but layoffs have not accelerated enough to create a meaningful hit to household income.
An important caveat is that US growth is increasingly K-shaped. Wealthier households have benefited from rising equity markets, higher cash yields and strong employment, while lower-income consumers remain under pressure from food, housing, fuel and borrowing costs. Moody’s estimates that the top 20% of earners now account for roughly 60% of US consumer spending, making overall consumption increasingly dependent on the upper end.
- Oil’s Roundtrip
Oil’s round trip was one of the clearest examples of markets looking through a shock once they believed it would be temporary. Brent moved from above $100 a barrel to around $118 at the peak of the Middle East disruption, before falling back towards $72 as conditions around the Strait of Hormuz improved.
But the pressure further down the barrel proved more persistent.
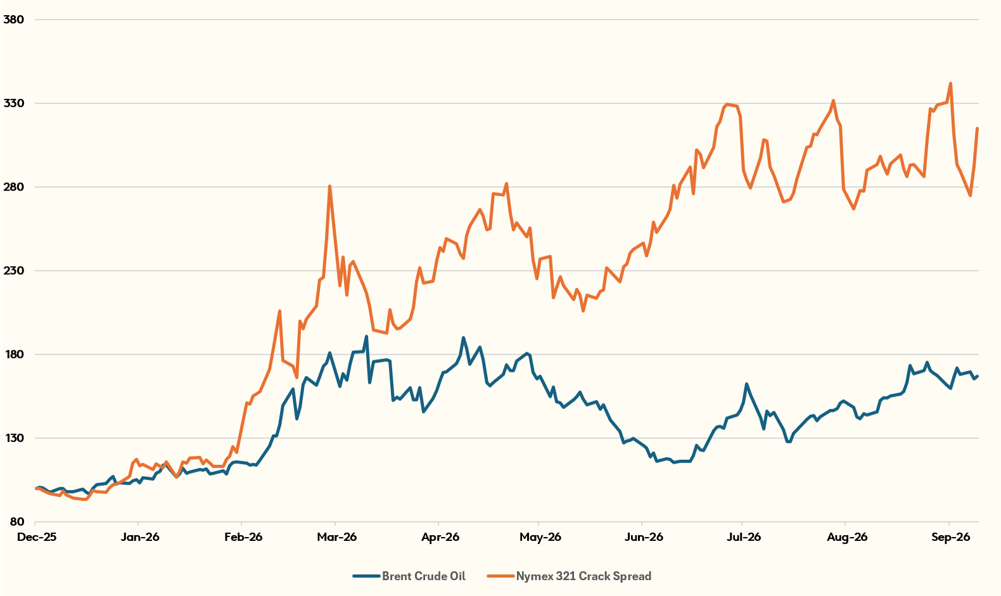
Exhibit 7: Diesel prices have risen more sharply than oil
Source: Bloomberg
Diesel prices remained elevated and diesel crack spreads widened sharply as refining capacity and distillate inventories stayed tight. That matters because diesel sits underneath trucking, agriculture, food distribution and logistics. So even when the crude oil headline improves, elevated refining margins can keep transport costs high and continue feeding into corporate margins and consumer prices. The lesson is therefore less about the peak oil price and more about the duration and transmission of the shock.
- Sticky Inflation and Stickier Central Banks
Inflation has remained higher for longer than markets expected. September CPI rose to 3.7% year-on-year, up from 3.4% in August, while core inflation increased to 2.6%. Energy remains a major driver, with higher gasoline and diesel prices adding renewed pressure to the headline number.
That has completely changed the central-bank conversation. We started the year debating how quickly policy could be eased. We are ending it with the Fed sounding considerably more hawkish and markets once again focused on the possibility of further tightening.
What has also changed is the Fed’s communication framework. Under Chair Warsh, there has been much less emphasis on forward guidance and the traditional dot plot, and much more emphasis on the direction of the data, the persistence of inflation and the balance of risks.
That makes the path of rates less predictable, but arguably more important. If inflation remains sticky, central banks stay restrictive, bond yields remain elevated, the hurdle rate for equities rises and borrowing costs remain high for households and companies.
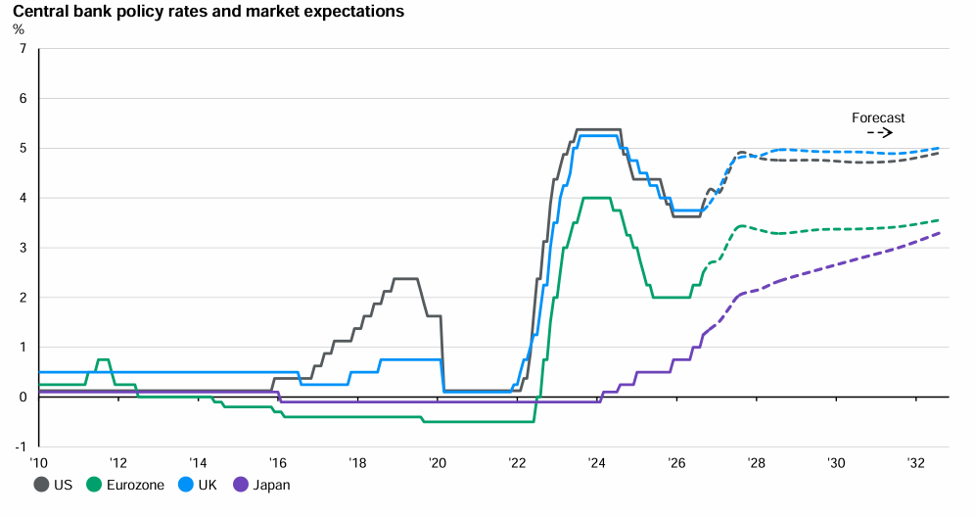
Exhibit 8: Central Bank Policy Rates
Source: JP Morgan
The question is therefore no longer simply whether inflation is falling. It is whether the trend is convincing enough for the Fed to believe 2% is genuinely within reach.
Further, an unusual feature of 2026 has been the contrast between the Fed and the Treasury. The Fed has moved towards less forward guidance and greater reliance on incoming data, while the Treasury has been more active in currency markets and in managing risks around global funding flows.
The Yen has been the clearest example. Washington’s concern is not simply the exchange rate itself, but the risk that disorderly moves encourage Japanese investors to repatriate capital or sell Treasuries.
So, an interesting tension is emerging between the two institutions. the Fed wants markets to do more of the price discovery, while Treasury is becoming more willing to intervene when that price discovery threatens financial stability.
- The Return of the Bond Market
While equities have spent much of 2026 looking through bad news, bonds have been considerably less forgiving. Long-dated yields across developed markets have moved back towards multi-year highs as investors demand more compensation for sticky inflation, heavy government borrowing, oil and geopolitical risk, rising corporate issuance and a higher-for-longer policy backdrop. Importantly, this is not just an inflation story. Higher real yields, fiscal concerns, resilient nominal growth and greater competition for capital are all part of it.
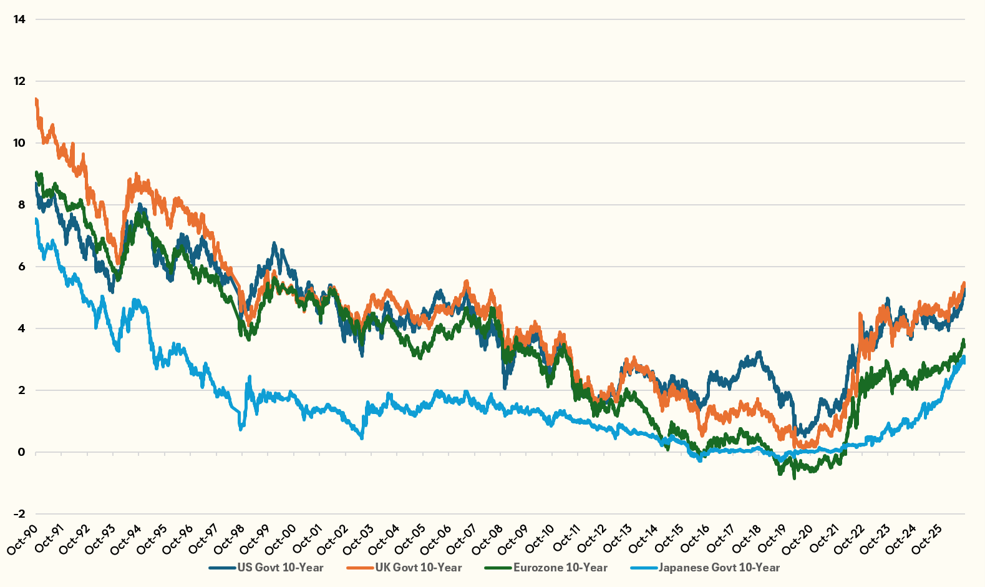
Exhibit 9: Global Bond Yields
Source: Bloomberg
If you zoom out, today’s bond yields look less like a new regime and more like a return to the old one.
US 10-year Treasuries averaged around 4.6% to 6.0% between 1999 and 2007, while UK 10-year gilt yields were generally around 4.4% to 5.3% in the years immediately before the financial crisis. The real anomaly was the post-GFC period, when QE, low inflation and near-zero policy rates pushed yields to levels investors gradually started treating as normal. They probably were not.
The important point is that 5% does not mean the same thing everywhere. In the US, higher yields can still be partly explained by resilient nominal growth. In the UK and France, investors are also demanding compensation for inflation persistence and fiscal uncertainty. The level matters, but the reason behind it matters more.
France is the more uncomfortable example. French 10-year yields have been trading close to 4.8% to 4.9%, while the spread over Germany has recently moved towards 140 basis points. France and Germany share the same currency and ECB policy rate, so that spread increasingly reflects the extra compensation investors want for French fiscal risk.
So, the level of the yield matters, but the reason behind it matters more. A 5% yield supported by healthy nominal growth is one thing. A 5% yield because investors are beginning to question the fiscal trajectory is quite another.
It is also important to separate inflation expectations from real yields. The rise in long-term yields has not simply reflected investors expecting inflation to spiral higher. A meaningful part of the move has come through higher real yields and a larger term premium, effectively investors demanding more compensation for locking money away for ten or thirty years in an environment of heavy government borrowing and greater policy uncertainty. In other words, this is not just an inflation tantrum. Bond investors have simply remembered that lending governments money for decades should probably come with a price.
And that brings us to the allocation question. For the first time in years, bonds offer a credible alternative to equities. That does not mean all parts of credit are equally attractive. All-in yields are appealing, but credit spreads remain relatively tight, meaning much of the additional return is coming from the higher risk-free rate rather than significantly better compensation for taking corporate credit risk. That argues for selectivity. High-quality bonds can look attractive at current yields, but moving further down the credit spectrum is obviously less rewarding.
- AI is now a credit story, too
The AI build-out has turned the hyperscalers into enormous borrowers. Amazon, Alphabet, Meta and Oracle alone issued roughly $194bn of bonds through early July, versus about $108bn in all of 2025, and estimates for the broader group are now above $200bn for 2026.
Much of this debt is being issued at investment-grade ratings, even as parts of the AI buildout sit off balance sheet or are financed through private-credit structures. Credit spreads remain tight because the hyperscalers themselves still have very strong fundamentals, at least on the balance sheet, but the scale of issuance means they are increasingly competing with governments and other borrowers for the same pool of capital. But investor demand still remains strong!
The AI story is therefore now becoming a credit story too. Tech issuance now represents roughly 4.5% of the ICE BofA Global Corporate & High Yield Index, which means passive bond investors are getting more exposure to the same theme already dominating equity portfolios.
That matters in three ways. First, there is increasing overlap between equity and credit exposure. Second, these are long-duration projects, with data centres often financed over very long tenors. Third, some of the risk may be harder to see because a meaningful portion of the financing sits off balance sheet or in private-credit structures rather than traditional corporate debt.
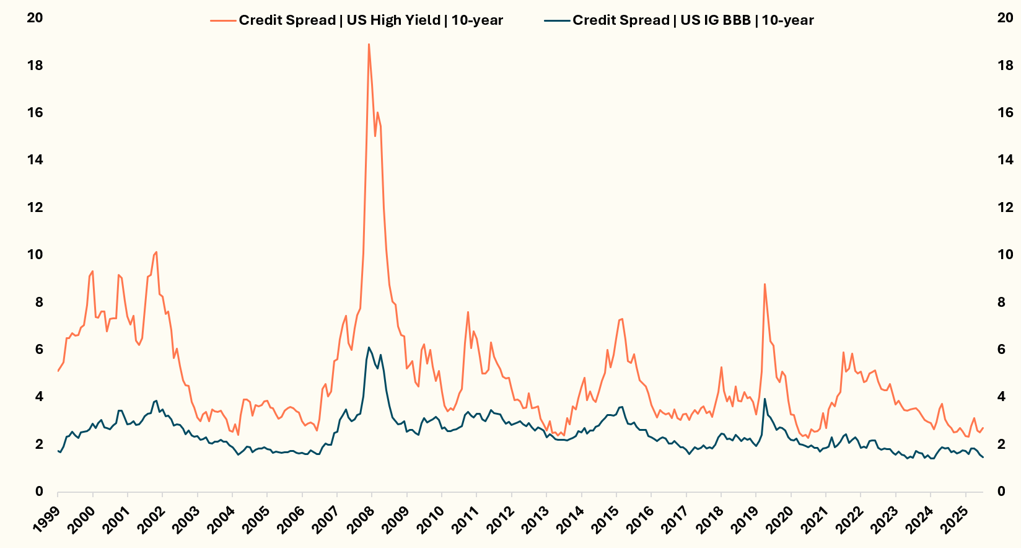
Exhibit 10: Spread on high yield and investment grade corporate bonds
Source: Bloomberg
- A Political Premium
Geopolitical risk is increasingly becoming a permanent part of asset allocation rather than a temporary source of volatility. As countries become more focused on strategic autonomy, energy security and domestic supply chains, the effects of political decisions are lasting longer and reaching further into markets.
The transmission is already visible. Higher defence spending supports parts of the industrial complex but also adds to already-large fiscal deficits. Tariffs, export controls and strategic competition between the US and China are reshaping supply chains, semiconductor access and corporate investment. The broader shift towards deglobalisation means companies are increasingly building redundancy into supply chains, governments are subsidising strategic industries, and investors are having to think more carefully about where assets are located as well as what they earn.
Domestic politics is now part of that premium too. Interestingly, markets are already beginning to price the possibility of a Democratic sweep in the November midterms. Prediction markets currently imply roughly a 92% chance of Democratic control of the House, 66% for the Senate and around 64% for a sweep of both chambers. That political repricing is already showing up in sectors. US defence stocks have weakened materially, with the iShares US Aerospace & Defence ETF down around 16% from July to mid-October, as investors reassess the durability of the administration’s proposed $500bn increase in military spending under a potentially different Congress. Healthcare has moved in the opposite direction, reflecting expectations that a Democratic Congress could take a different approach to Medicaid spending and broader healthcare policy.
The significance goes beyond those two sectors. A change in congressional control would also have implications for corporate taxation, bank regulation, technology policy and the regulatory environment around AI infrastructure. The point is not that one political outcome is inherently positive or negative for markets, but that investors are increasingly having to price policy risk alongside earnings and interest-rate risk.
That is exactly what we mean by a growing political premium.
Looking into Q4 2026 and 2027, we are keeping a close eye on France’s fiscal position and approaching presidential election, the US midterms, the shifting UK political landscape and continued geopolitical tensions. Each has the potential to influence bond yields, currencies, trade policy, defence and healthcare spending, and where global capital ultimately chooses to sit.
That reinforces the broader message of this review. Investors are being presented with more opportunities, but also more sources of risk that cannot simply be diversified away by owning another index. Understanding the political, fiscal and economic drivers beneath each investment is becoming increasingly important.
In Conclusion, A Higher Hurdle for Risk
The investment environment looks very different from the one investors became accustomed to after the financial crisis.
Our base case is not for a collapse in growth or a broad retreat from risk. Growth remains positive, corporate earnings are still supportive, and the AI investment cycle continues. But inflation is proving more persistent, financing costs are higher and market leadership has become increasingly concentrated. That means the hurdle for taking risk is materially higher.
Within equities, we continue to see opportunities, but increasingly at the company level rather than through indiscriminate index exposure. Europe and Japan also offer genuinely different earnings drivers through banks, industrials, defence, automation and corporate-governance reform.
Within fixed income, higher-quality government bonds now provide meaningful income and potential upside if inflation cools and yields eventually fall. Investment-grade credit also offers attractive all-in yields, although tight spreads argue for selectivity rather than simply taking more credit risk.
And cash itself has become useful again.
For much of the post-GFC period, investors were effectively penalised for waiting. Today, they can earn a meaningful return while deciding where the next opportunity lies. The question is no longer whether investors should take risk. It is where they are still being paid enough to take it. For once, patience comes with a coupon.